matlab subplots packed densely together
January 11, 2015 at 07:15 AM | categories: xmgr, matlab, octave, gmt | View Comments
During significant portion of my grad-school I had to travel a lot. I therefore couldn't rely on hooking to the university matlab license, so I searched for free alternatives. While you could use a lot of good projects, such as octave to crunch your numbers, it seems to me that making beautiful figures is not so easy.
I got used to plotting with the excellent packages of GMT . I even wrote some little octave wrapper functions around GMT, since it's easy to get intimidated by their too elaborate man pages. You could still try them out, though GMT has been working lately on an official matlab API for you (they do have mature API for c++/Fortran). I didn't try it myself, yet. Another option is good old xmgr . Both of them produce great imagery, but they have their limitations at times.
The one point where matlab excels is better set of default parameters. You don't have to worry so much about the line thicknesses, page width etc., as much as in the other options mentioned above. The cons side, obviously, is when you don't want the defaults. Easy things like packing your subplots close are not so easy in matlab. It's of course, nevertheless, still possible. Mainly with axis/plot handles.
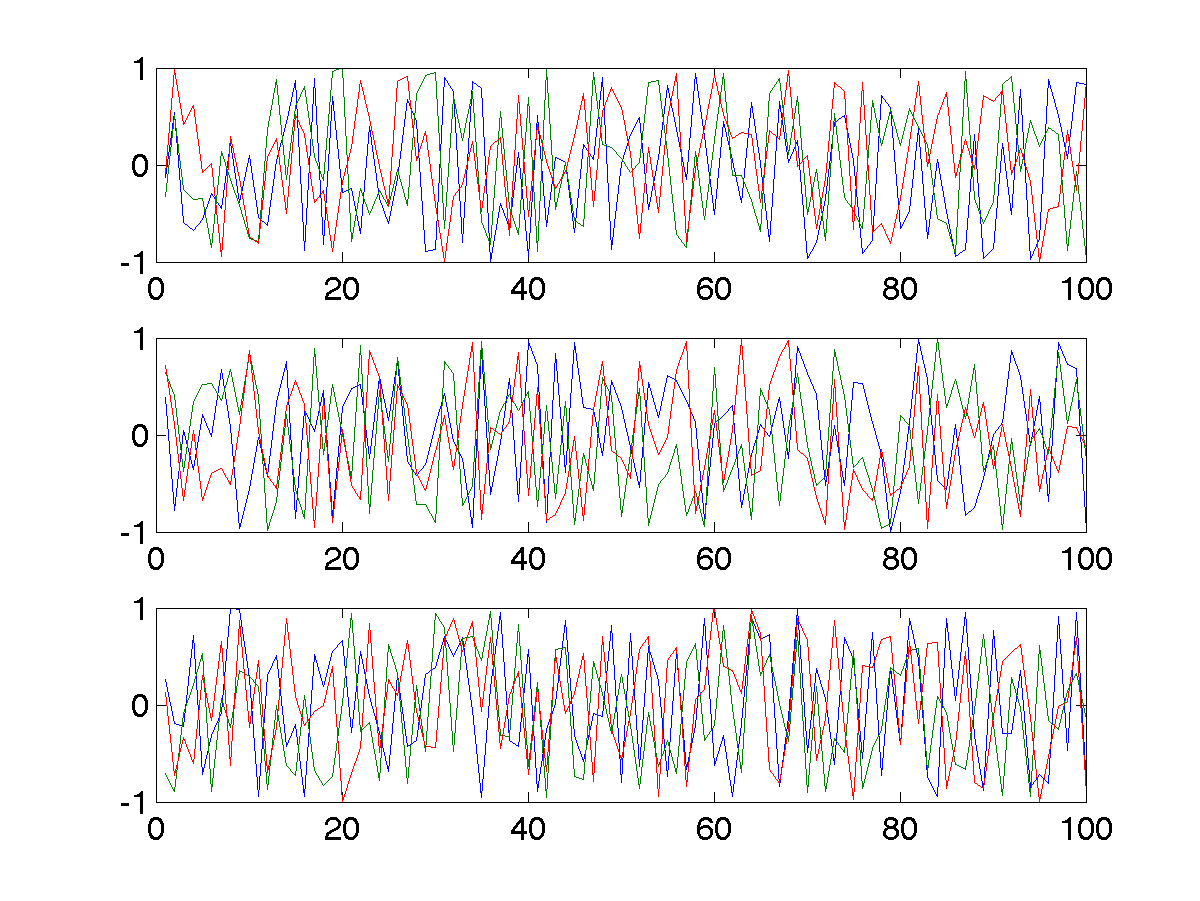
Here's how you do it : first let's create our figs:
1: nsubs=3;
2: for isub=1:nsubs
3:  subplot(nsubs,1,isub);
4:  plot(rands(3,100)');
5:  set(gca,'fontsize',16);
6: end % for i=1:nsubs
7: savefigs('nopack_subplots','save demo of packed graphs',[]);
that's the result:

Figure 1: before
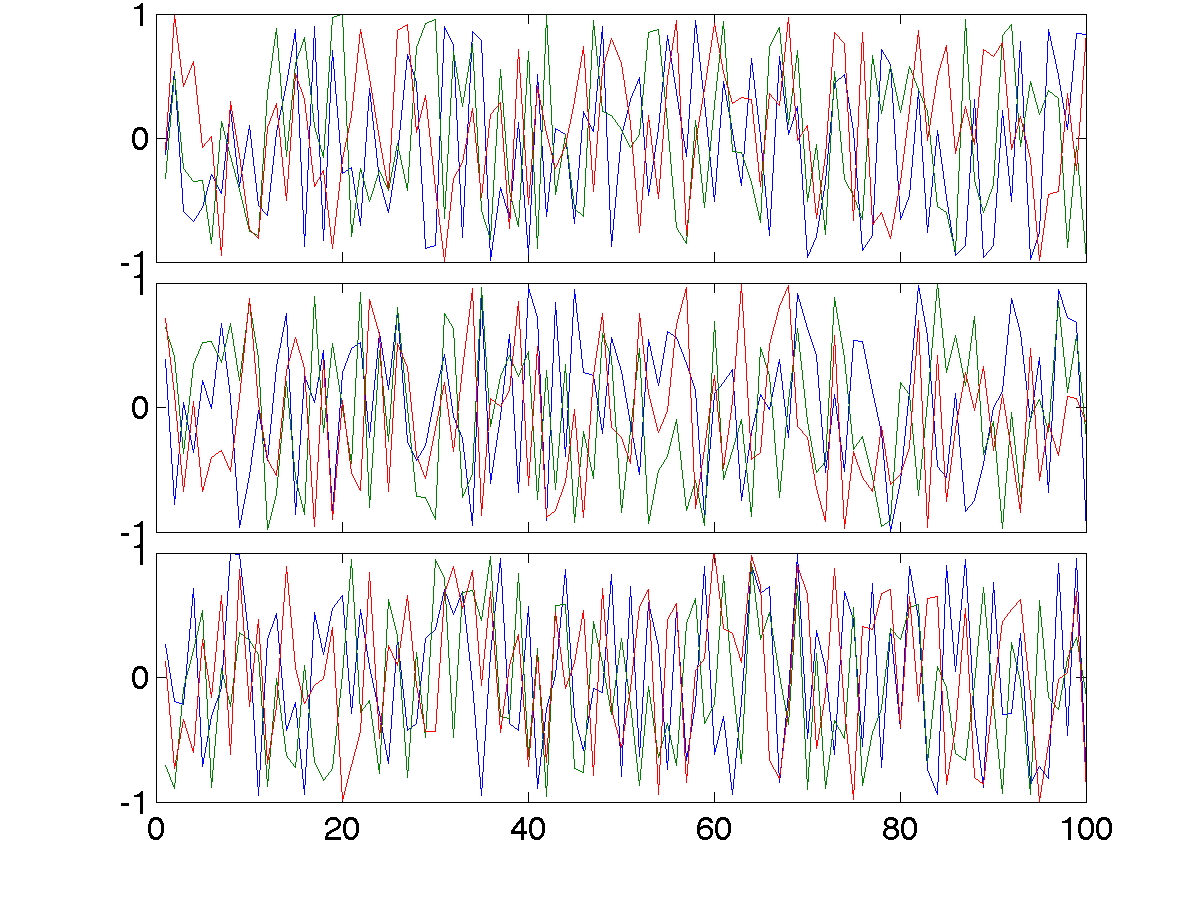
now , lets pack them:
 1: packing_const=0.06
 2: for isub=1:nsubs
 3:  h=subplot(nsubs,1,isub);p = get(h, 'pos');
 4:  if(isub<nsubs)
 5:   set(gca,'fontsize',16,'XTickLabelMode', 'Manual','XTickLabel', []);
 6:  else %  if(isub<nsubs)
 7:   set(gca,'fontsize',16);
 8:  end %  if(isub<nsubs) ... else ...
 9:  set(h,'pos',[p(1) p(2) p(3) p(4)+packing_const]);
10: end % for isub=1:nsubs
11: savefigs('pack_subplots','save demo of packed graphs',[]);
that's our "after" exhibit :

Figure 2: after
The "savefigs" function is non standard. Its aim is to save images in fig/eps/png formats at once, and generate README file and a mat file on the fly, with consistent names.
Copyright (C) 2015 by Avi Gozolchiani. See the License for information about copying.